Phase Analysis
The new analysis marks thermals in green on the map and in the barogram and single-circle attempts in red, while gliding phases remain white. You can activate the analysis on the left side of the flight page with the button "Phase analysis". The analysis always refers to the turning points of the competition selected on the left.
Single Phases
In addition, another line is displayed above the barogram, which shows you the exact values for this flight phase. The lower line still refers to the position of the cursor in the barogram.
Thermal phases
Time - Altitude Diff - ⌀ Climb Rate - ⌀ Speed - Bank & Direction
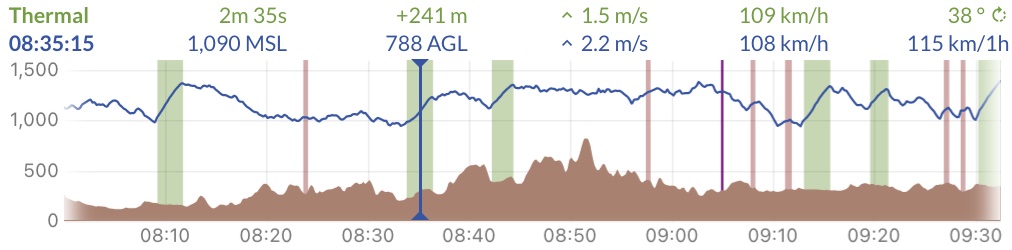
In the thermals above, 241 meters of altitude were climbed in 2 minutes and 35 seconds. The average climb was 1.5 m/s, the average speed was 109 km/h and it was thermalled right with a bank angle of 38°.
Glide phases
Distance - Altitude Diff - Glide Ratio - ⌀ Speed - Detour in %
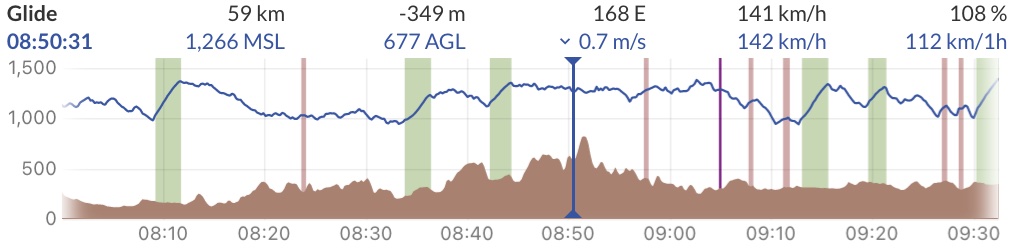
Distance is the length of the straight line from the starting point of a gliding phase to the ending point of the gliding phase. Detour is the quotient of the distance actually covered in straight flight to the former distance.
Attempts
A single-circle attempt counts if one of the two points is met:
- thermalled for less than 40 seconds
- thermalled for less than 100 seconds and climbed less than 50 meters
Attempts do not interrupt a gliding phase, i.e. a gliding phase goes from one thermal to the next thermal.
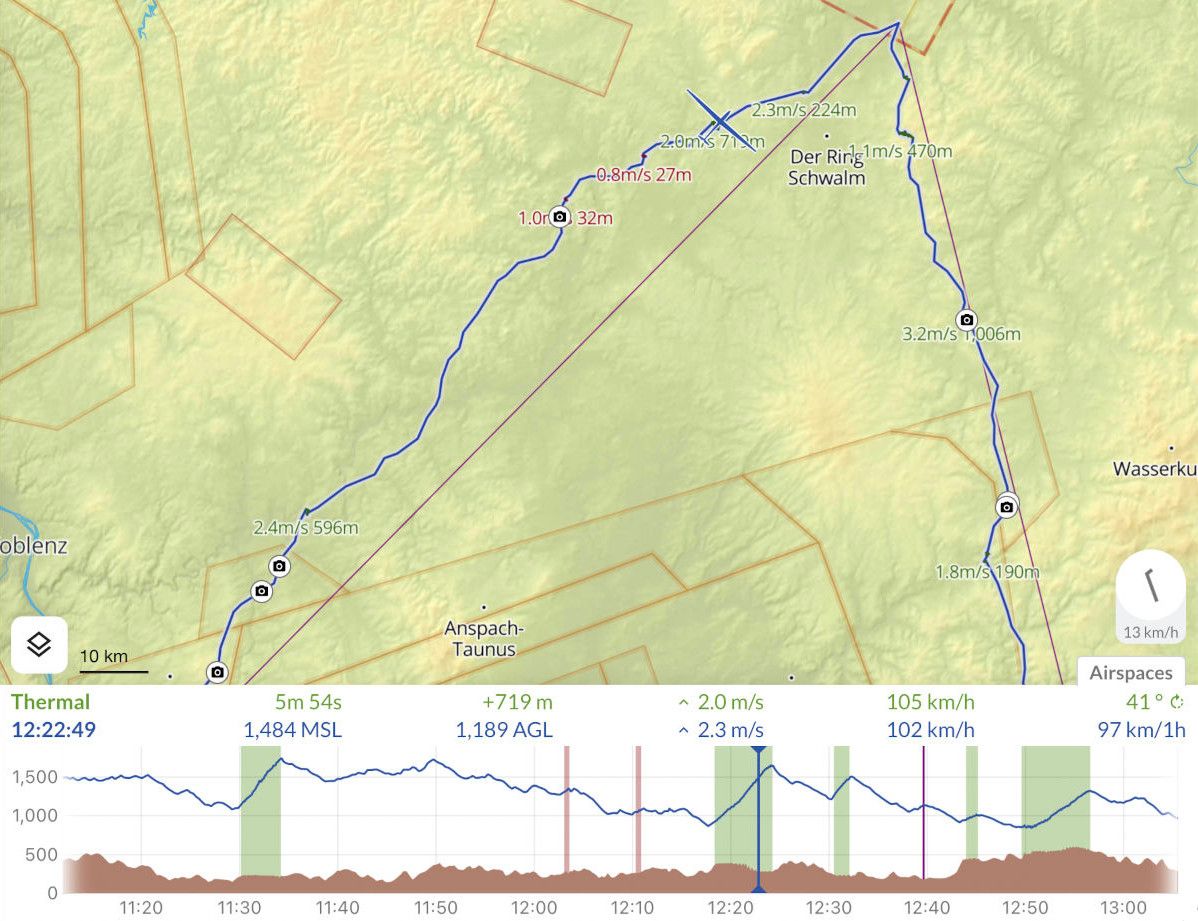
Map
In addition, the climb values of the individual thermals are displayed on the map, so that you can find the good (and bad) thermals directly.
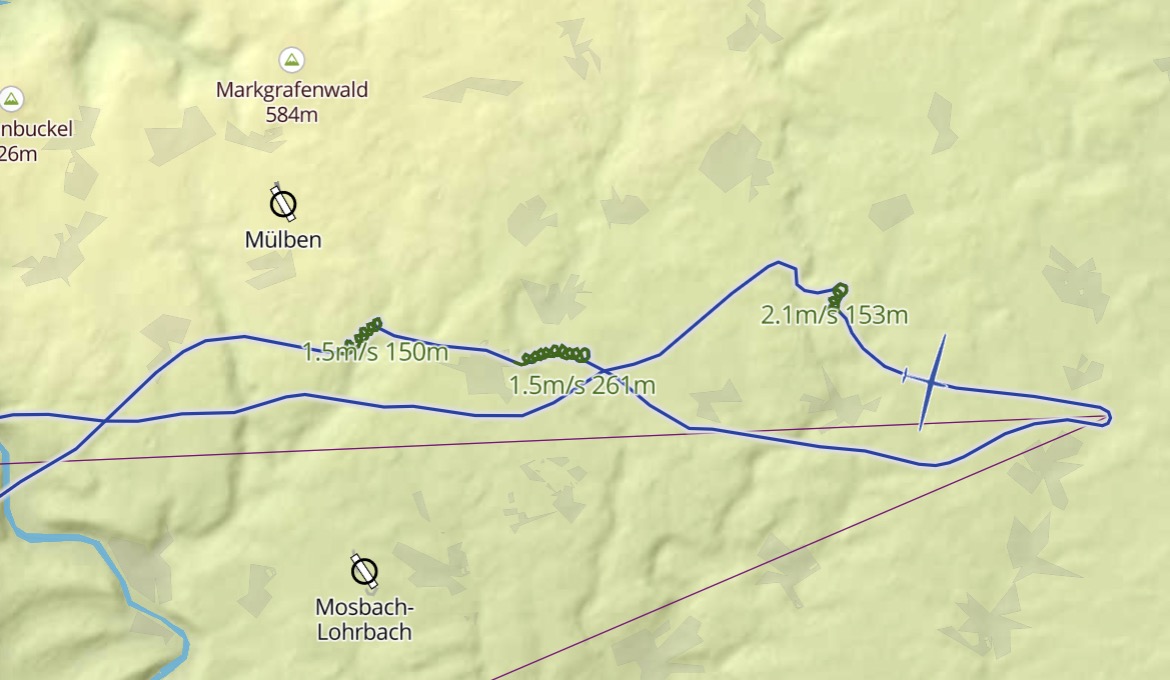
If the flight phase analysis is activated, a wind indicator also appears in the lower right corner of the map.
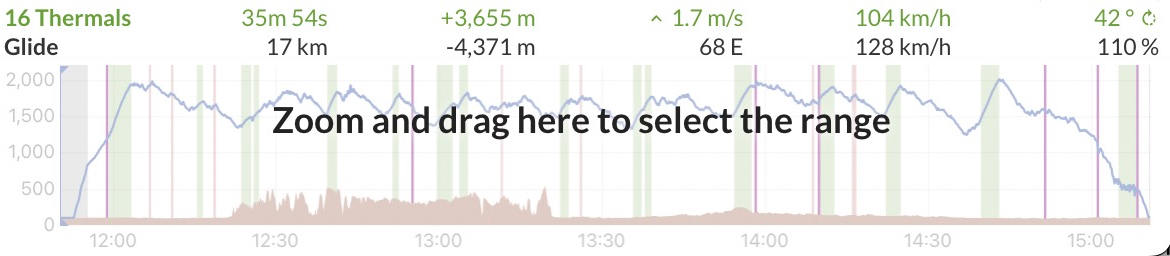
Barogram Range
If you want to analyse a specific part of your flight, e.g. a cloudstreet or a the way to your final flight, you can also enable "Barogram Range". Single flight phases will still be marked in the barogram and on the map, but the information above the barogram will switch function.
You'll find the averaged values seperated into thermals and glide phases.
The column for thermals contains the following parameters:
Count - Duration - Altitude Diff - ⌀ Climb Rate - ⌀ Speed - Bank & Direction
For glide phases:
Distance - Altitude Diff - Glide Ratio - Glide Speed - Detour in %