
Statistics List
On every one of our lists, you can use the button in the lower right corner to switch between different list types. By selecting Statistics, you can see different statistical data about the flights you are viewing.
This allows you to compare yourself to other pilots that were flying on a particular day and identify changes in your style of flying immediately. But you could also filter by your name and see how your flying style and skills have changed over time.
Contest
The statistics always reference the contest you have selected in the top left. So you can select the Free or Sprint contest to see different statistics.
Coloring
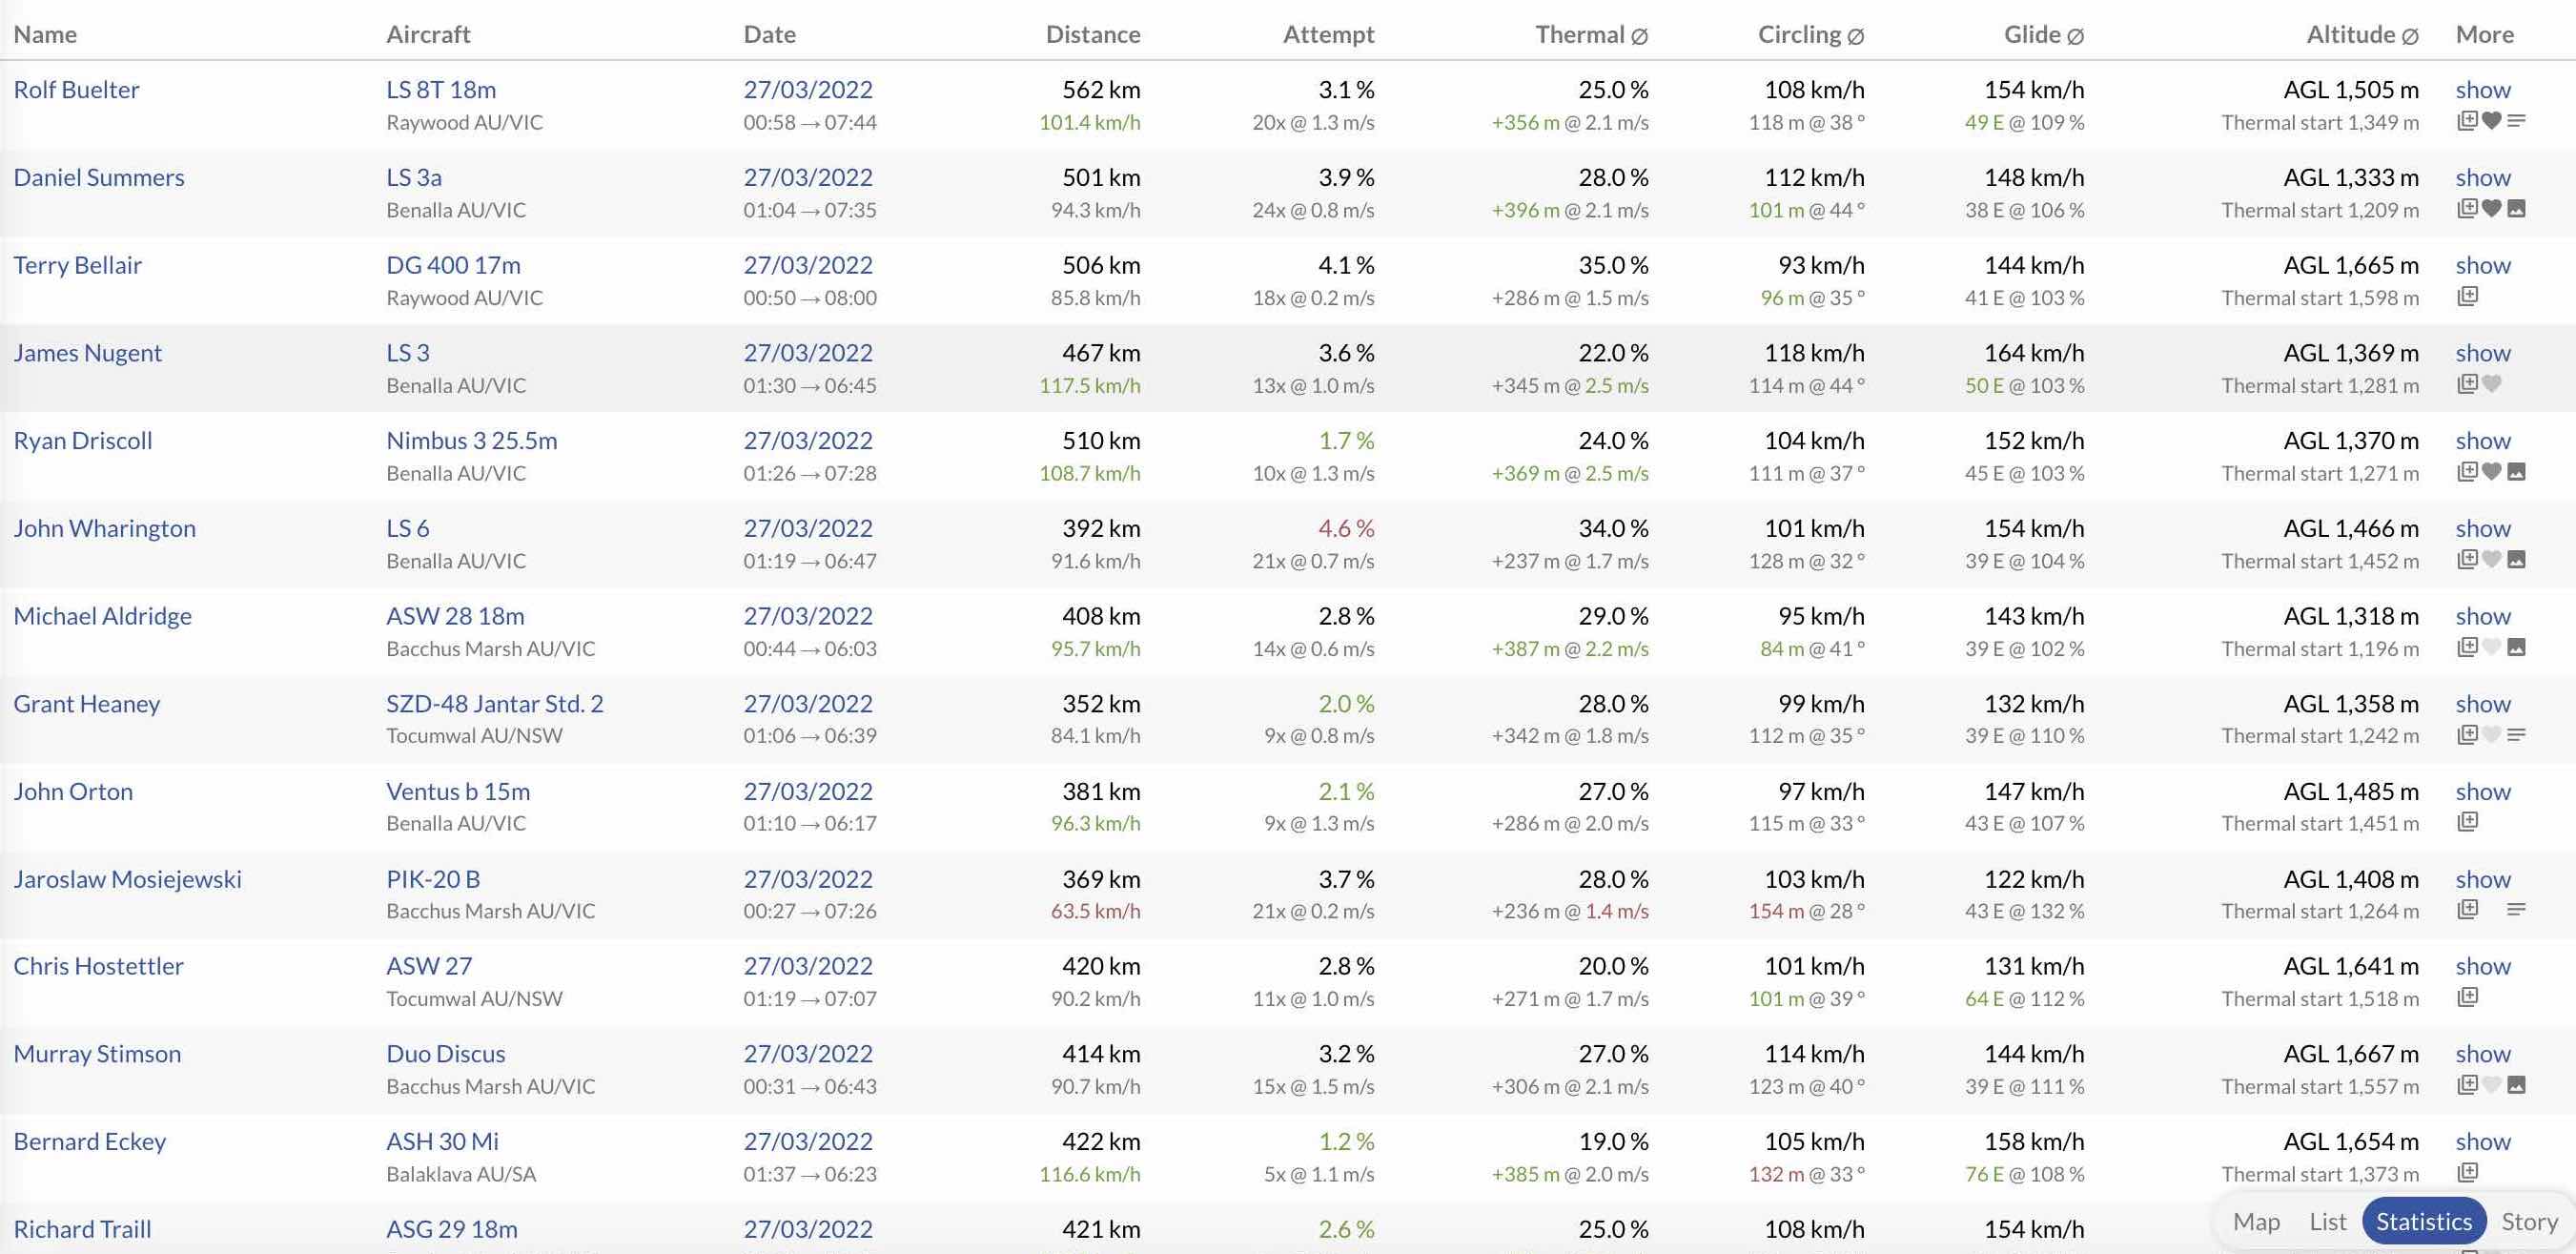
Several of the statistical values are highlighted with colors. The top quarter of flights with the best values regarding a particular statistic are colored in green (e.g., best vario value while thermaling, lowest percentage of time spent in attempts). The bottom quarter of flights is colored in red.
Summing Up
In the footer of the table you find the average values over all of the flights. This enables to compare your average values of a particular season to the ones of different pilots.
Values
On the left side of the list, you can find information regarding the flight: The name of the pilot, the aircraft, and the takeoff airport. The statistical data is presented in different groups.
Attempt
Attempt displays the number of times a pilot tried to enter a thermal but didn't gain signifiant height and moved on after on or two circles. You can see the number of attempts, the percentage of the flight time that was spent in attempts and the average vario value.
Thermal
Next to that you find some thermal statistics. You can see the perentage of flight time that was spent thermaling (excluding attempts). Below that, the average altitude gained per thermal and the average vario while thermaling are shown.
Circling
One column further to the right, the circling statistics are displayed. On top is the average speed while thermaling (excluding attempts). Below that, the average circle radius and average bank angle are displayed.
Glide
The glide section show the average speed while gliding (not thermalling and not attempting). Below that the achieved L/D and the detour while gliding is displayed.
Altitude
The altitude column shows two values. The first is the average altitude MSL (above mean sea level) over the complete flight. The second is the average altitude AGL (above ground) at which thermals (not attempts) were entered. These also help to identify different flying styles.