
Statistics
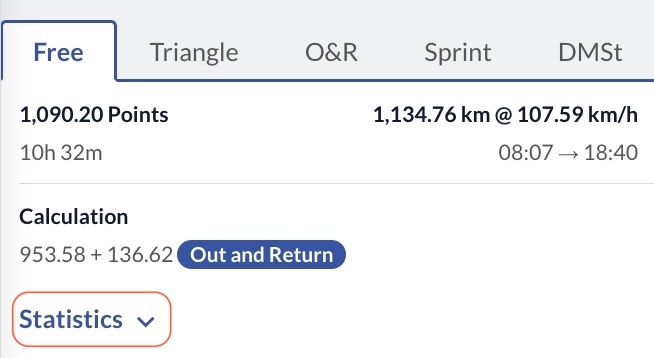
WeGlide provides many statistics that can help you analyse a flight. You can open up the detailed statistics tables by clicking on Statistics. Here we give an overview of what the different statistics mean and how they are calculated.
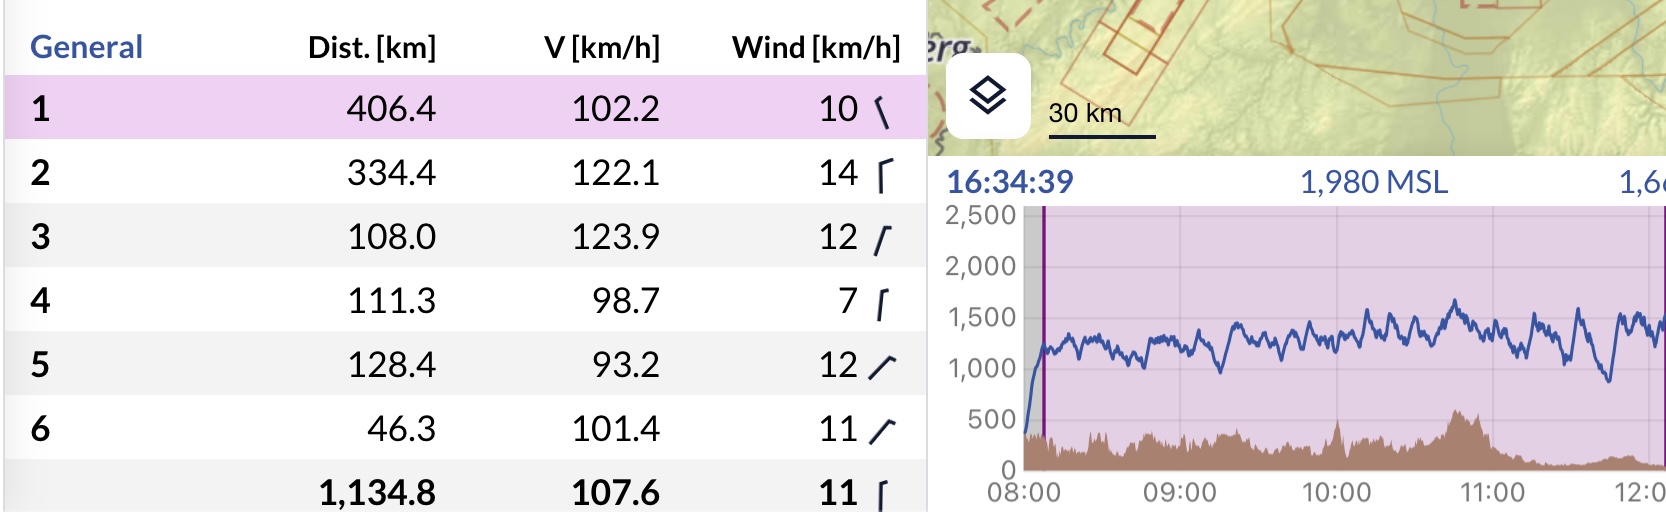
If you click on a single leg, it will be highlighted on the map and in the barogram:
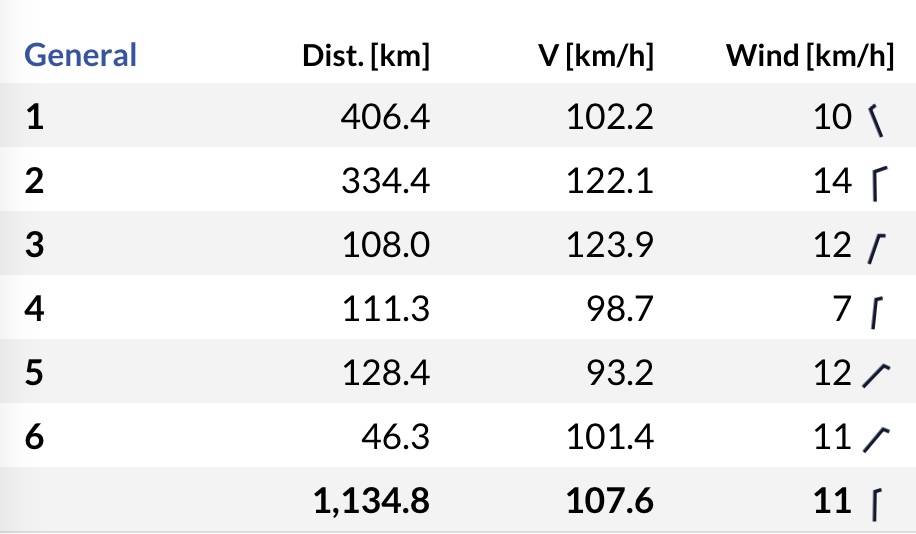
General
The top table contains the most important statistics. You can see three different values:
- The distance of each leg
- The speed that was achieved on the leg
- The wind direction and speed
The wind is calculated from all flight data, so even if you are not circling, we can make an accurate wind prediction.
For triangles starting on a leg, the partial start and end leg is split in the table and the barogram but combined in the map.
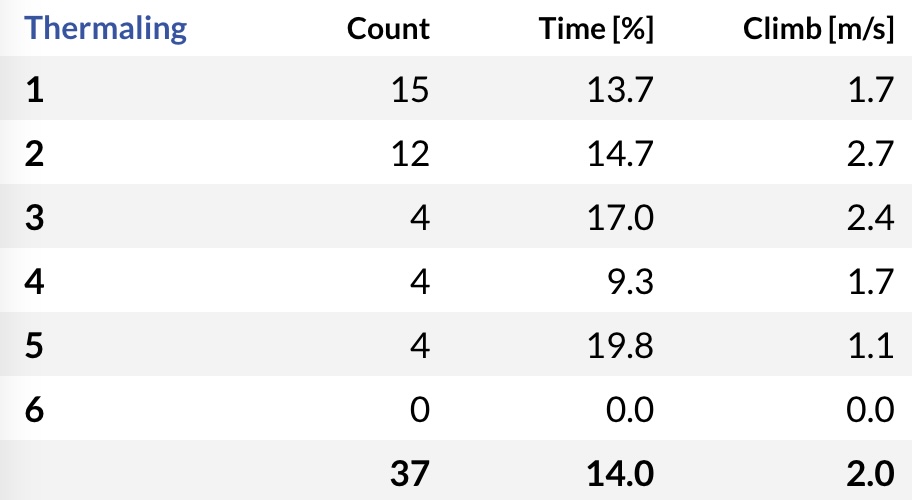
Thermals
The thermal table provides information regarding the thermals during the flight:
- The number of thermals
- The percentage of the whole time spent in thermals (but not in attempts)
- The average climb rate
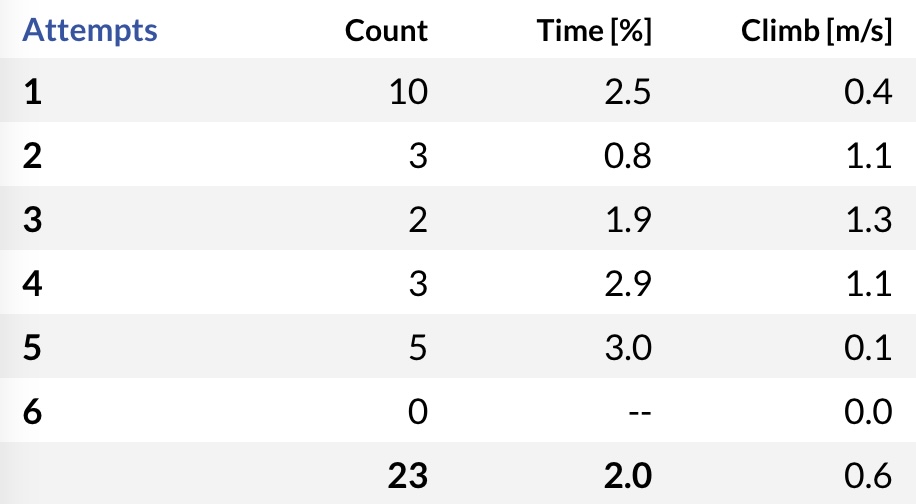
Attempts
A thermal is classified as an attempt if
- The altitude gained was less than 50 meters or
- Only one circle was made
The attempt table provides information regarding the thermals attempts during the flight:
- The number of attempts
- The percentage of the whole time spent in attempts
- The average climb rate in attempts
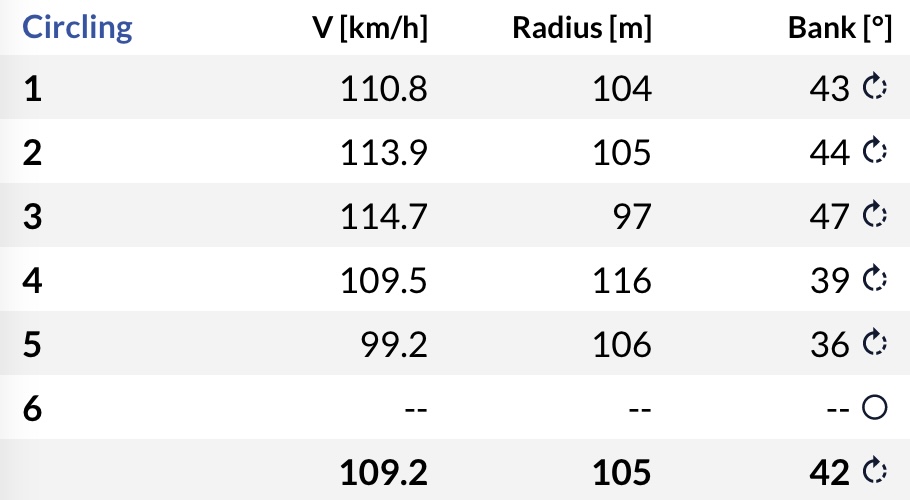
Circling
The circling table provides information regarding your flight performance while circling (thermals and attempts):
- The average speed you were flying at while circling
- The average radius you achieved while cicrling
- The average bank angle while circling
We are able to calculate the bank angle by using the radius and speed. If your aileron and rudder are not perfectly in sync while circling and you are slipping a bit to the inside, your true bank angle is a bit lower than we show.
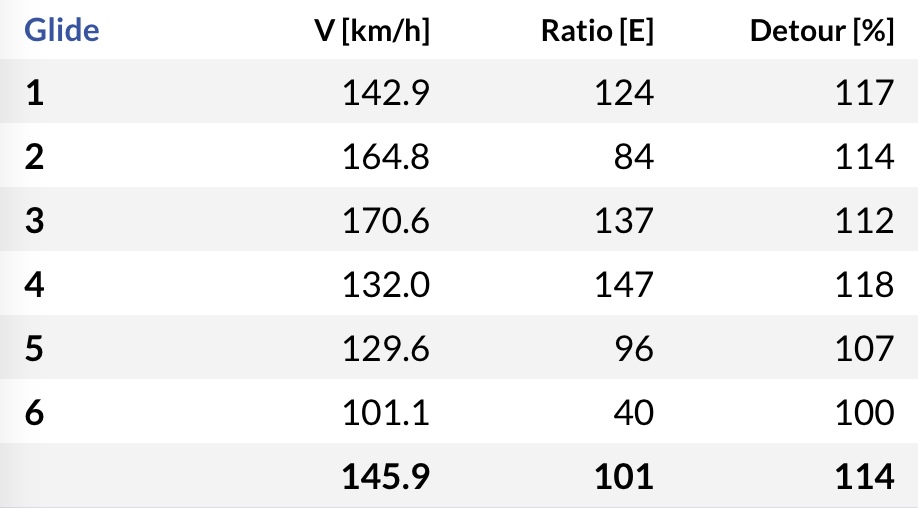
Glide
The glide table provides information regarding flight performance while gliding:
- The average speed you were flying at while gliding
- The glide ratio you achieved.
- The average detour
The detour is defined as the ratio between the track distance (the entire length of the track you were flying without circling) and the (straight) distance of the leg.
The glide ratio is defined as the ratio between the altitude you have lossed (or gained) while gliding and the (straight) distance of the leg.
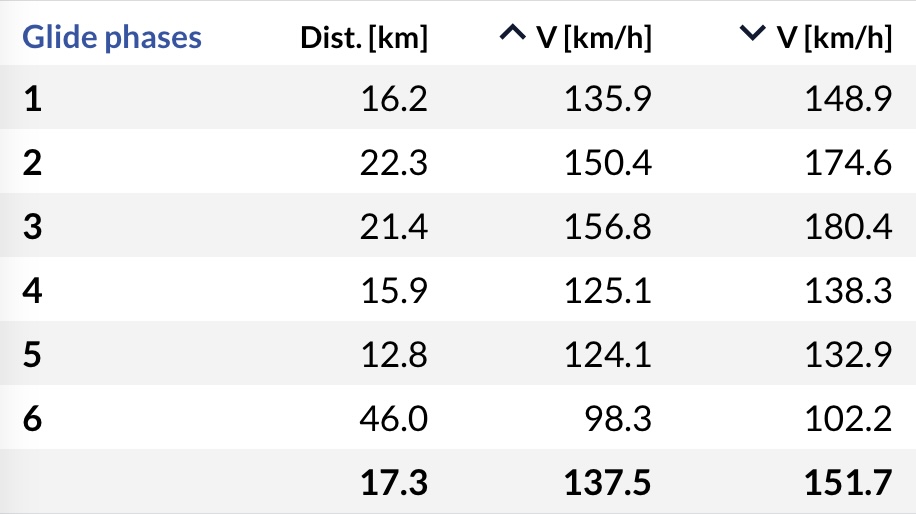
Glide phases
The glide phase table provides more information regarding flight performance while gliding:
- The average distance of a single glide
- The speed while gliding with vario > 0
- The speed while gliding with vario < 0
The distance of a single glide is defined as the straight distance between two thermals. A glide phase is not interrupted by an attempt, so if you have a 150 km long glide phase, there might have been some attempts inbetween.
The comparision of cruise speeds while in rising and sinking air gives an indication how much the speed is changing while cruising.
If you are interested in even more statistics, check out the Statistics List.